
Class 20 Looking Back & Moving Forward
1 Causal Machine Learning
1.1 When Machine Learning Meets Causal Inference
Causal Machine Learning (CML) represents the state-of-the-art development in the field of data science.
Conventional machine learning excels at finding patterns and making predictions, but it often falls short in understanding causality.
Conventional causal inference techniques (instrumental variable, DiD, RDD) estimate average treatment effects, and they mostly rely on linear regressions and are not good at estimating heterogeneous treatment effects across individuals.
This is where causal machine learning steps in, aiming to uncover these causal relationships borrowing the predictive power of machine learning tools.
- Microsoft Research has developed
EconML, which is the industrial pioneer in CML.
- Microsoft Research has developed
1.2 Causal Forest
Causal Forest developed by Athey, Tibshirani, and Wager (2019) (Generalized Random Forest), a part of the CML toolkit, is an extension of the original random forest algorithm.
The core idea of Causal Forest is to estimate the causal effect of a treatment using recursive binary splitting similar to decision trees in random forest. It does so by building a large number of causal trees, each based on a subset of data and features.
grfis the R package that can implement causal forest. Stanford YouTube channel also provides comprehensive tutorial videos on causal forest.
Code
pacman::p_load(grf, fixest, dplyr, ggplot2, ggthemes)
## Use the DiD data to illustrate the causal forest
data("base_did")
data_Y <- base_did %>%
mutate(Post = ifelse(period >= 6, 1, 0)) %>%
group_by(id, Post) %>%
summarise(avg_outcome = mean(y)) %>%
group_by(id) %>%
summarise(first_diff = avg_outcome[2] - avg_outcome[1]) %>%
ungroup()
data_W <- base_did %>%
select(id, treat) %>%
unique()
data_X <- base_did %>%
filter(period < 6) %>%
group_by(id) %>%
summarise(avg_x = mean(x1)) %>%
ungroup()1.3 Application of Causal Forest in Causal Inference
- We can use causal forest to estimate the treatment effects for each individual and plot the histogram.

1.4 Policy Learning
Once we know the treatment effects for each individual, we can further automate the targeting decision using the estimated treatment effects. This is called policy learning in the causal machine learning field.
The goal of policy learning is to learn a treatment assignment rule (policy) that maximizes the overall outcome in the population. In R, we can use the
policytreepackage to implement policy learning.Application in marketing:
- Personalized Promotion: Only send coupons to customers who are positively sensitive to price reduction.
- Churn Management: Only target customers who can be “saved” by retention campaigns.
2 NLP and LLM
2.1 NLP in Marketing Analytics
Natural language processing (NLP) and text mining are powerful tools for analysing unstructured text data in marketing analytics.
Application in marketing:
- Use sentiment analysis to analyse customer reviews, social media posts, and other text data to understand customer sentiment.
- Use topic modelling to analyse customer feedback, social media posts, and other text data to identify key topics and themes.
- Use GPT to copilot with human managers regarding product descriptions, email messages, or social media posts.
- Use LLM to generate survey responses for your term 3 dissertation project. Follow this guide.
- More applications of LLM in marketing: Generative AI in innovation and marketing processes: A roadmap of research opportunities
2.2 Bag-of-Words (BoW) Methods
- Conventional Bag-of-Words (BoW) Methods: Treat text as a “bag” of its words, disregarding grammar and word order but keeping multiplicity.
- Common techniques include counting word frequencies or TF-IDF (Term Frequency-Inverse Document Frequency).
- Useful for simple tasks like spam detection or basic sentiment analysis but fails to capture context (e.g., distinguishing “not good” from “good”).

2.3 Transformer-based Large Language Models (LLM)
- Transformer-based Large Language Models (LLM): Use “attention mechanisms” to understand the context and relationships between words in a sentence, regardless of their distance.
- Examples: BERT (Bidirectional Encoder Representations from Transformers), GPT (Generative Pre-trained Transformer).
- These models are pre-trained on vast amounts of text data and offer superior performance in understanding nuance, semantics, and generating human-like text compared to BoW methods.
- I highly recommend Hands-on Large Language Models, e-book freely available at UCL library here.
2.4 Sentiment Analysis
- Sentiment analysis is the process of determining the sentiment (positive, negative, or neutral) of a piece of text. It is widely used in social media monitoring, customer feedback analysis, and brand reputation management.

2.5 Sentiment Analysis: Applications
- Application: Use sentiment analysis to analyse customer reviews, social media posts, and other text data to understand customer sentiment.
- Stratify: “Candidates can use NLP techniques to generate stock sentiment, analyse sentiment from external sources (eg from social media posts), and then analyse this alongside pricing data to generate a stock price prediction.”
- Klick2Learn: “The Qualitative Insights Panel complements the dashboards by analyzing open-ended student feedback through sentiment analysis and topic modeling. By extracting themes and sentiment trends, this component identifies underlying satisfaction drivers and areas needing attention. The panel uses advanced NLP techniques, such as RoBERTa embeddings and classical models, to deliver actionable insights in a lightweight and robust manner.”
2.6 Topic Modeling
- Topic modelling is a type of statistical model for discovering the abstract “topics” that occur in a collection of documents. Latent Dirichlet Allocation (LDA) is one of the most popular topic modelling algorithms.
- BOW:
topicmodelspackage implements LDA topic modelling. - LLM-based topic modelling:
BERTopicleverages transformer-based embeddings for topic modelling.
- BOW:

2.7 Topic Modeling: Applications
- Application: Use topic modelling to analyse customer feedback, social media posts, and other text data to identify key topics and themes.
- ITV: “outcomes we are looking for are: a summary of key points for each campaign test based on free text fields, using topic modelling (e.g. K-means, LDA) to identify thematic trends;”
- Lebara: “The project will focus on three core NLP components: sentiment analysis to gauge customer satisfaction, topic modelling to identify common themes and concerns, and churn prediction to flag at-risk customers.”
3 Our Journey This Term
- Let’s reflect on our journey this term and see how you can apply them in your dissertation project and future career.
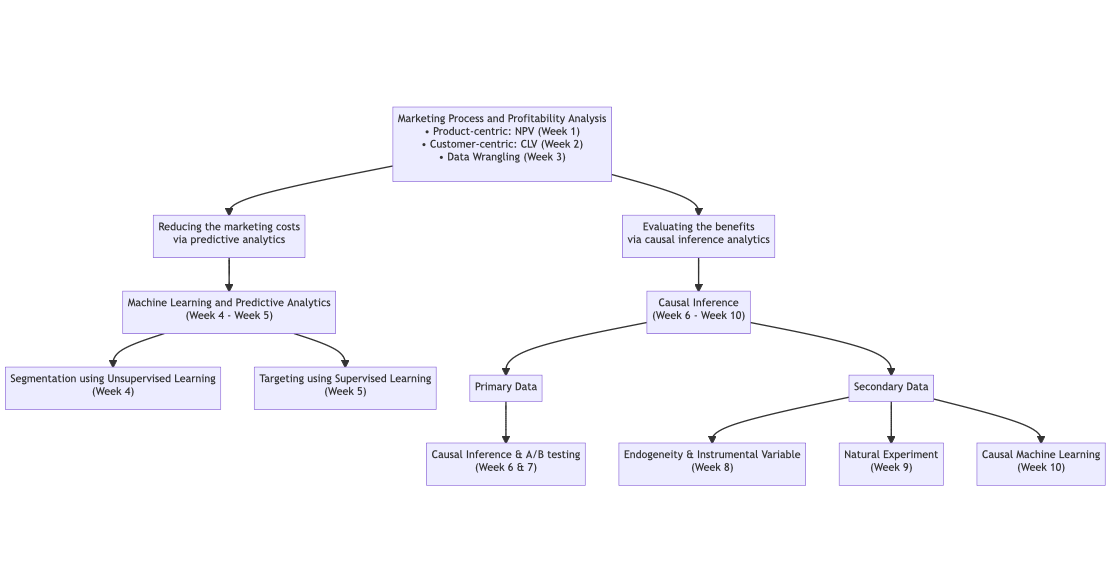
3.1 Week 1: Marketing Process

Tip
Conduct a situation analysis in the Introduction section of your dissertation.
3.2 Week 1-2: Profitability Analysis
- Break-even analysis is essential to any business activity
- For business campaigns: Break-even quantity (BEQ) and Net present value (NPV)
- For customers: Customer lifetime value (CLV)
- Case study:
- CLV Analysis for M&S’s Delivery Pass (Week 2)
- CLV for Tom’s Bubble Tea Shop (1st assignment)
Tip
- Fulton: “Calculate the predictive lifetime value of customers”
- Lebara: “building a tenure prediction model that will feed into and enhance our CLTV model.”
- Economist: “goes through an A/B test to assess its impact on key metrics such as Customer Lifetime Value (CLTV)”
3.3 Week 1: Hey, I’m Wei, and I’m a Youtuber!

3.4 Week 3: Data Wrangling and Descriptive Analytics with dplyr
- Data wrangling with
dplyr- basic operations:
filter,mutate,select,arrange - group aggregation:
group_by
- basic operations:
- Descriptive analytics with
ggplot2(visualization),modelsummary(summary statistics), anddplyr(data wrangling).
Tip
- Somerce Ltd: The primary objective of this project is to create a user-friendly dashboard that consolidates and visualises key performance metrics from TikTok Shop. This dashboard will be updated weekly and will provide clients with essential insights into their brand’s growth and engagement on the platform. By presenting data on buyer location, age, purchasing behaviour, and revenue trends, we aim to facilitate informed decision-making and optimise marketing strategies.
- Chanel: “Collate the data in a dashboard and present it in a visual format easily accessible; Build a dashboard to track energy consumption and create alerts and insights for trend deviations and consumption monitoring”
3.5 Week 3: Hey, I’m Wei, and I’m a musician!


3.6 Week 4: Unsupervised Learning for Customer Segmentation
- Unsupervised learning such as K-means clustering help classify individuals into different segments. We then decide which segment(s) to serve based on our business objective.
Tip
ITV: “a summary of key points for each campaign test based on free text fields, using topic modelling (e.g. K-means, LDA) to identify thematic trends”
DataVisionServices: “… we will build a framework of site selection for the client. To do so we see the student using multiple techniques, such as location analysis, clustering and building algorithms…
3.7 Week 5: Supervised Learning for Customer Targeting
- Supervised learning models learn the relationship between outcome \(Y\) and \(X\) and can make individualized prediction.

- Fundamental concepts in supervised learning:
- Bias-variance trade-off
- Overfitting and underfitting
- Accuracy-interpretability trade-off
- Tree-based models (decision tree, random forest, gradient boosting) are widely used in marketing analytics due to their high accuracy and interpretability.
3.8 Week 5: Application in Marketing: Personalized Targeting
- With targeted marketing from supervised learning, we can effectively reduce marketing costs and boost the ROI.
- Improving Marketing Efficiency Using Predictive Analytics for M&S (Week 5)
- 2nd assignment: Amazon Prime case
Tip
- British Transport Police: “use ML to predict victims of crime”
- Economist: “which picture to attach to social media post to increase engagement”
- Barclay: “use predictive analytics to predict house prices”
- etc.
3.9 Week 6: Why Causal Inference Matters?
- Managers easily make costly mistakes if they do not understand causal inference.


3.10 Week 6: I’m Wei and I’m from Hogwarts!

3.11 Week 6: Potential Outcomes and A/B Testing
The gold standard for causal inference in marketing analytics is A/B testing.
Basic Identity of Causal Inference: randomisation helps us break the link between confounding factors (selection bias) and treatment assignment, allowing us to estimate causal effects.

Tip
Designing or analysing A/B testing data: Economist/Fehmida/4thewords/etc.
Generally not recommended if you need to run A/B testing for your dissertation due to higher risks. Analyzing previous A/B testing data is a better choice.
3.12 Week 7 & Week 8: Linear Regression, Endogeneity, and Instrument Variables
- Linear regression on secondary data can never give causal inference due to endogeneity problems.
- Endogeneity: (1) omitted variable bias; (2) reverse causality/simultaneity; (3) measurement error.
- An instrument variable can give causal inference, which satisfies (1) exogeneity (2) exclusion restriction (3) relevance (4) observable (implicit).
- Marketing Mix Modelling (MMM) is a common application of linear regression in marketing analytics. Many dissertation companies require students to build MMM models.
Tip
- Barilla: is seeking to develop a cost-effective method for creating Marketing Mix Models (MMM) for smaller markets by scaling down existing models from similar larger markets.
- Molson: “Molson Coors spends £millions on its UK Marketing plans each year. It needs to optimise its spend for the best return on its investment: both on the channel mix and flighting within brands; and on the budget allocation across brands in the Molson Coors portfolio.”
3.13 Week 9: Regression Discontinuity Design

- Receiving “Distinction” on students’ salaries: 69.9 versus 70
- Review stars on sales on e-Commerce platforms: 4.74 versus 4.75
3.14 Week 10: Difference-in-Differences Design

- A new policy/regulation (GDPR, lockdown, etc.) and we have a control group which remains unaffected
- If parallel trend is violated, we can use synthetic difference-in-differences method.
- You can smartly combine DiD with A/B testing.
4 Concluding Remarks
4.1 10 Weeks Not Enough?
More learning materials on marketing analytics
Optional reading materials in each week
I will keep uploading R tutorials/data analytics tools/interview related tips on my Youtube channel. It’s never too late to subscribe!
I love new challenges so my door is always open even after the module is over. Welcome to talk to me about your dissertation ideas; I’m more than happy to help with your dissertation project.
4.2 What I learned
Impressed with your perseverance and willingness to learn
- My bestie (your Operations module leader) predicts you would chase me out of the classroom for making you learn Marketing, R, and many complex models at the same time
You’ve given me a lot of inspiration and motivation to keep innovating, learning and improving (b^_^)b
It gives me a huge sense of achievement to see that you are able to apply R in your assignment and projects.
It gives me a weird sense of achievement to receive questions for other modules (´・_・`)
4.3 Thank you for being the BEST Students I can ever dream of!!
Code
library(ggplot2)
t <- seq(0, 2 * pi, length.out = 1000)
x <- 16 * sin(t)^3
y <- 13 * cos(t) - 5 * cos(2 * t) - 2 * cos(3 * t) - cos(4 * t)
data_of_love <- data.frame(love_x = x, love_y = y)
ggplot(data_of_love, aes(x = love_x, y = love_y)) +
geom_point(colour = "red", size = 0.5) +
theme_minimal() +
annotate(
"text",
x = 0,
y = 0,
label = "To My Lovely BA Students",
colour = "red",
size = 5,
hjust = 0.5,
vjust = 0.5
)
In 5 years (hopefully not 5 months) you may forget the lectures but only remember the following
A module leader who is crazy about bubble teas and makes lousy weekly pre-class videos; he aims to be a good musician, Youtuber, magician, and lecturer
A lame senior named Tom, who messed up everything because he spent too much time on Python (I forgive you, Tom)
4.4 One Last Thing…
- I owe you one …
