Improving Marketing Efficiency Using Predictive Analytics for M&S (I): Customer Segmentation Using K-Means Clustering
MSIN0094 Case Study
1 Predictive Analytics and Marketing
Machine learning (ML) refers to the study of methods or algorithms designed to learn the underlying patterns in the data and make predictions based on these patterns. A key characteristic of predictive analytics techniques is their ability to produce accurate out-of-sample predictions. Consider the problem of predicting whether a user will click on an ad. We do not have a comprehensive theory of users’ clicking behaviour. Predictive analytics methods can automatically learn which of these factors affect user behaviour and how they interact with each other, potentially in a highly non-linear fashion, to derive the best functional form that explains user behaviour virtually in real time. Predictive analytics methods typically assume a model or structure to learn, but they use a general class of models that can be very rich.
Predictive analytics models can be divided into two major groups: supervised learning and unsupervised learning.
Supervised learning requires input data that has both predictor (independent) variables and a target (dependent) variable whose value is to be estimated. If the goal of an analysis is to predict the value of some target variable (e.g., whether a customer responds to our marketing offers; whether customers churn at some point in time), then supervised learning is used.
On the other hand, unsupervised learning does not identify a target variable, but rather treats all of the variables equally as inputs. In this case, the goal is not to predict the value of a variable, but rather to look for patterns, groupings, or other ways to characterise the data that may lead to an understanding of the way the data interrelate. Clustering analysis is an example of unsupervised learning, which helps data analysts find customer segments based on provided characteristics.
In this case study, we are going to analyse the same dataset as in “Descriptive Analytics for M&S”. Our task is to use predictive analytics tools to help M&S conduct more effective targeted marketing.
As a quick recap, the variable definitions are as follows,
Demographic Variables
- ID: Customer’s unique identifier
- Year_Birth: Customer’s birth year
- Education: Customer’s education level
- Marital_Status: Customer’s marital status
- Income: Customer’s yearly household income
- Kidhome: Number of children in customer’s household
- Teenhome: Number of teenagers in customer’s household
- Dt_Customer: Date of customer’s enrolment with the company
Customer Purchase History Data
- ID: Customer’s unique identifier
- MntWines: Amount spent on wine in the last two years
- MntFruits: Amount spent on fruits in the last two years
- MntMeatProducts: Amount spent on meat in the last two years
- MntFishProducts: Amount spent on fish in the last two years
- MntSweetProducts: Amount spent on sweets in the last two years
- NumDealsPurchases: Number of purchases made with a discount
- NumWebPurchases: Number of purchases made through the company’s website
- NumCatalogPurchases: Number of purchases made using a catalogue
- NumStorePurchases: Number of purchases made directly in stores
- NumWebVisitsMonth: Number of visits to the company’s website in the last month
- Complain: 1 if the customer complained in the last two years, 0 otherwise
- Response: 1 if customer accepted the offer in the last campaign, 0 otherwise
- Recency: Number of days since customer’s last purchase
2 Tom’s Return from the Maldives: A Predictive Analytics Adventure
After a much-needed holiday in the Maldives, where he spent his days sipping bubble teas (yes, even in the Maldives there are bubble tea shops), Tom finally returned to face reality. Feeling recharged, he opened his laptop only to be greeted by the ominous sight of the M&S dataset waiting for him. His task? To clean up the data before diving into predictive analytics for customer segmentation and targeting.
“I’m a proud graduate of UCL’s BA programme,” Tom thought confidently. “How hard can this be?”
He launched his Jupyter notebook, cracked his knuckles, and started writing Pandas code. But after just a few lines, reality hit him hard—his data wrangling looked like a tangled mess of spaghetti!
Without the beloved pipe operators in Python, Tom was forced to write a new line of code for each data wrangling step. Before long, his intermediate datasets were scattered all over the place, and the operations were so unintuitive that he began questioning why anyone would willingly subject themselves to Python for data wrangling. It also brought back some, well, traumatising memories of the weekly Python quizzes he had to endure during his time at UCL.
“Why did I even bother with those dreadful Python quizzes when R is the best language in the world?” Tom muttered under his breath. “I really should have listened to Dr Meow, who kept encouraging us to practise R during those Thursday Python classes.”
Realising he was in trouble, Tom did what any smart person would do in this situation: he turned to you, a rising star in data science from this year’s BA programme. “Please,” he pleaded, “help me clean this M&S dataset using R. I need to show M&S how to segment and target their customers more effectively with predictive analytics, and I can’t afford another disaster.”
And so, your task begins: to help Tom make sense of the M&S data using the power of dplyr and predictive analytics techniques. In return, Tom promised that the next time he goes on holiday, he’ll bring you back a giant bubble tea from the Maldives.
2.1 Data Collection
Please load the M&S dataset from your local machine. You can use the “import dataset” button in RStudio to upload the dataset. The dataset is named data_full.csv. Name the dataset data_full.
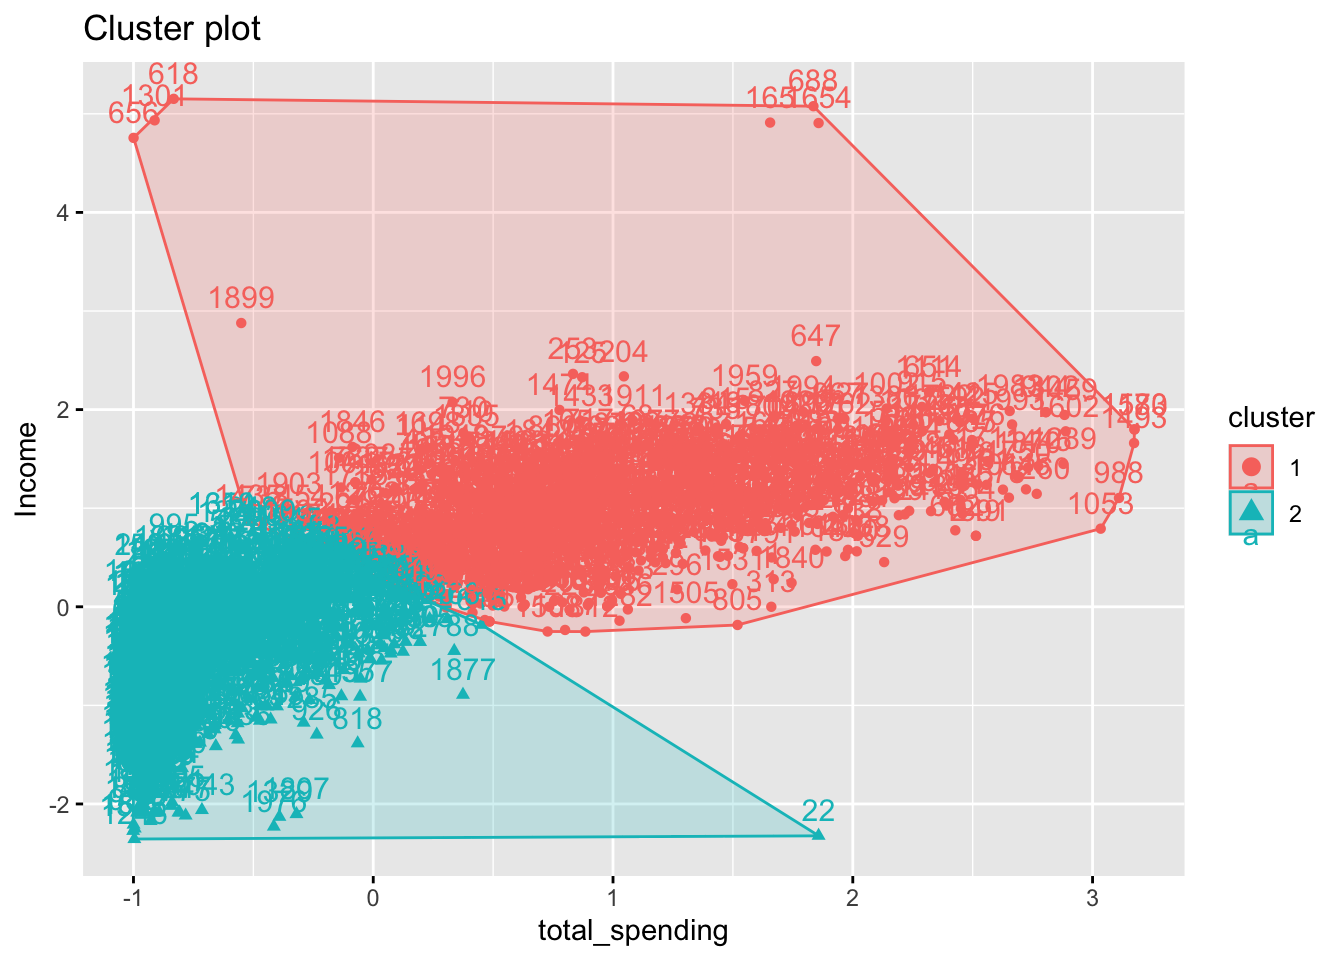
Load data_full, create total_spending, and select total_spending and Income as the clustering variables into a new data frame data_kmeans.
2.2 Data Pre-processing
First, we need to check for missing values and resolve them, as the k-means algorithm cannot handle missing values directly.
Next, we need to rescale the two variables using scale(), because the two variables are on very different scales.
Scale the variables and create a new data frame data_kmeans_scaled.
Code
# method 1
data_kmeans_scaled <- data_kmeans %>%
select(total_spending, Income) %>%
mutate(
total_spending = scale(total_spending),
Income = scale(Income)
)
# method 2: using across when there are many variables with the same transformation
data_kmeans_scaled <- data_kmeans %>%
select(total_spending, Income) %>%
mutate(across(everything(), scale))2.3 Data Analytics
- Determine the optimal number of clusters using statistical criteria
Elbow Method
Code
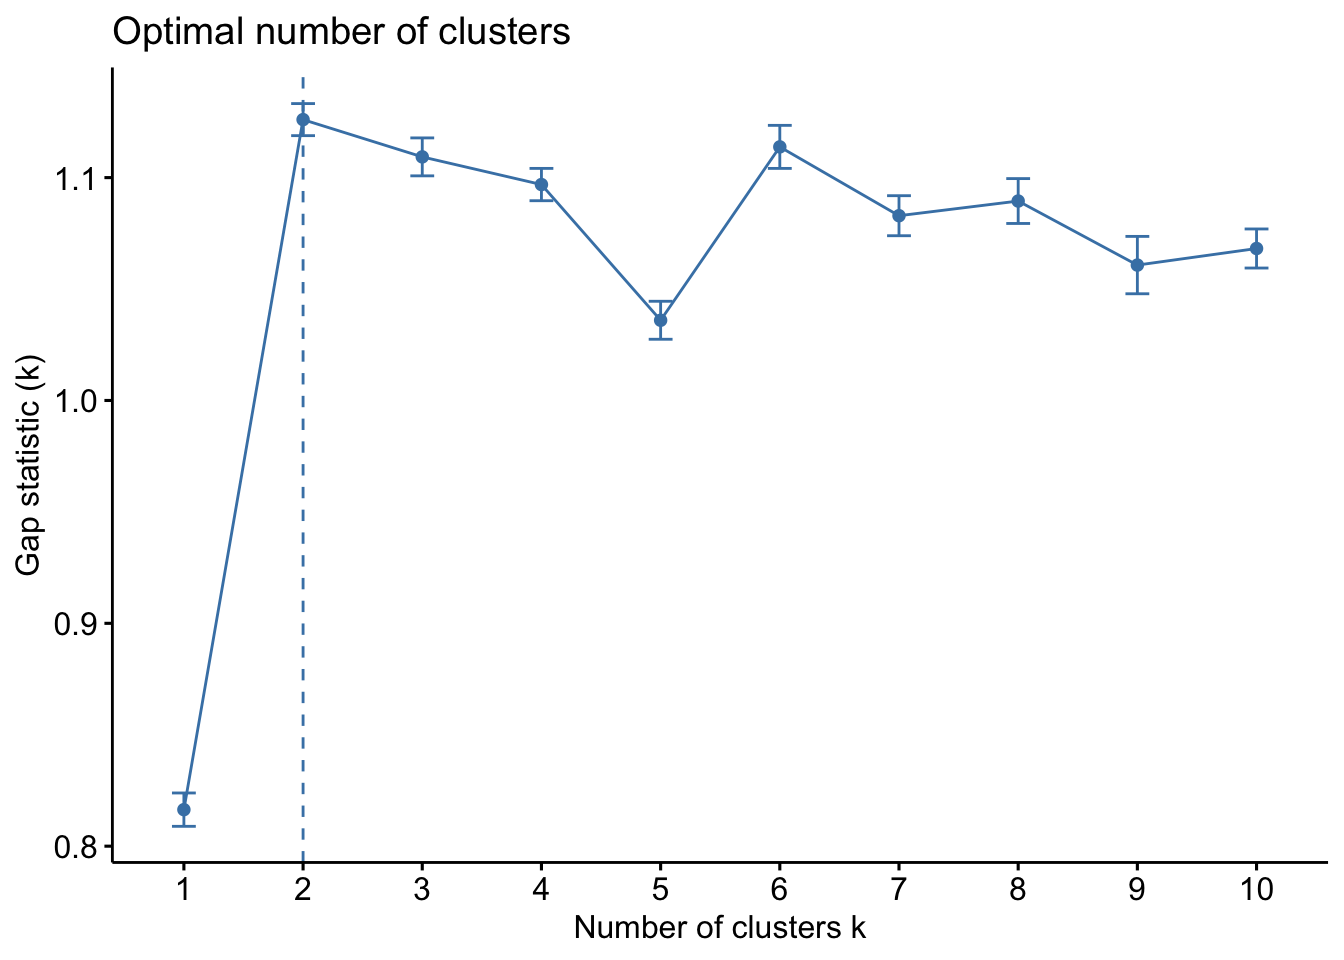
From the elbow plot, we can see that the optimal number of clusters is 4. Therefore, we can re-run the K-means algorithm with centers = 4.
2.4 Business Recommendations
After segmenting the customers into the optimal groups, we can now analyse the segments to understand their characteristics and behaviours. For example, we can compare the average response rates to marketing offers in the segments, and decide which segment to target when launching the next marketing campaign, to save marketing costs.
As we would like to save marketing costs by sending marketing offers to responsive customers, we need to compute the average response rate for each segment generated by the K-means algorithm.
- Generate the customer segment in
data_full.
- Compute the average response rate for each segment.
Code
If you find that one segment has a significantly higher average response rate than the others, you can recommend M&S to target customers in that segment for the next marketing campaign, to improve marketing efficiency and ROI. This is because, given the same cost per offer sent, targeting customer segments with higher response rates will lead to more conversions (i.e., customers accepting the offer), thereby increasing the overall return on investment for the marketing campaign.